IVANHOE GOLF CLUB RESULTS ANALYSIS
The database of scores returned by the members of Ivanhoe Golf Club over the three years to March 2012 has been used to carry out an analysis to determine the fairness or otherwise of the handicapping system that is used.
First, we need to consider what is a fair system. In simple terms, this would be a system in which any player, regardless of handicap has an equal chance of winning an event. A second desirable feature for a gradeless competition using a points accumulation system, would be for any player, regardless of handicap, to have an equal chance of becoming the Club Champion.
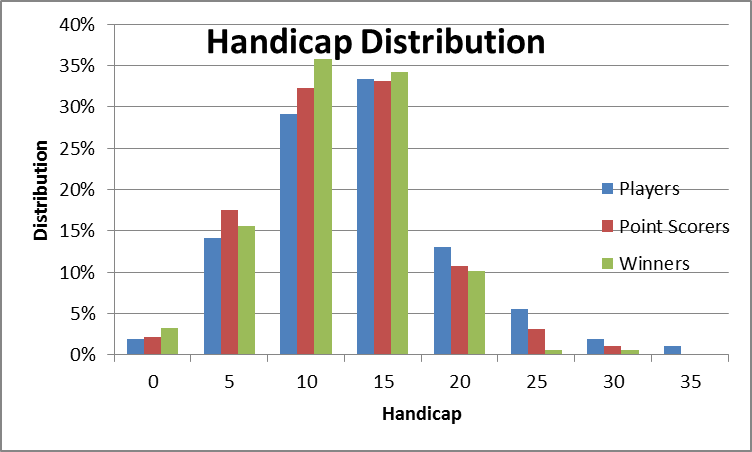
For all of the scorecards submitted during the three years, the handicap of the competitors for each game was considered and divided into groups to give the distribution of handicaps of all players. The totals in each handicap group were converted to percentages and this distribution was plotted on a chart.
For all of the events during the three years, the handicap on the day of the players who scored points was considered and divided into groups to give the distribution of handicaps of point scorers. The totals in each handicap group were converted to percentages and this distribution was plotted on the same chart as the Distribution of Handicaps. The same procedure was done for winners.
The left hand chart shows that there is a difference in the distribution of point scorers and winners in relation to the distribution of players.
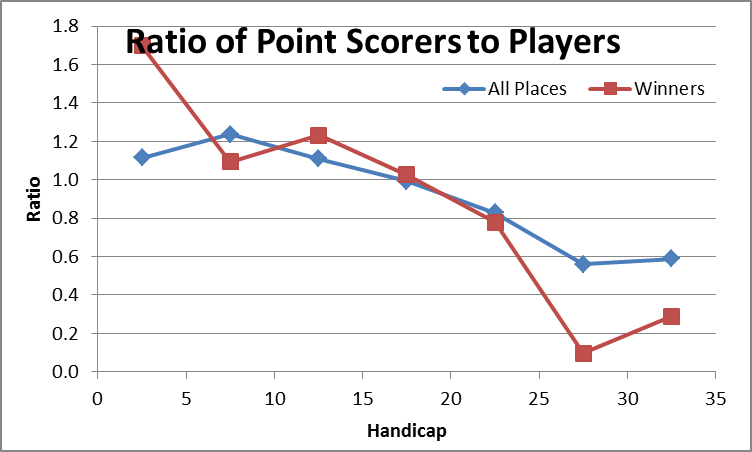
Another way to look at this is to consider the ratio between the distribution of point scorers and winners and the distribution of players. The right hand chart indicates that there is a consistent trend in the point scorers ratio. The trend is very similar for winners though there is some variability possibly due to the smaller number of data sets for winners.
If we accept that all players should be equally represented in point scoring, the ratio would be at or about 1.0 through all handicap ranges.
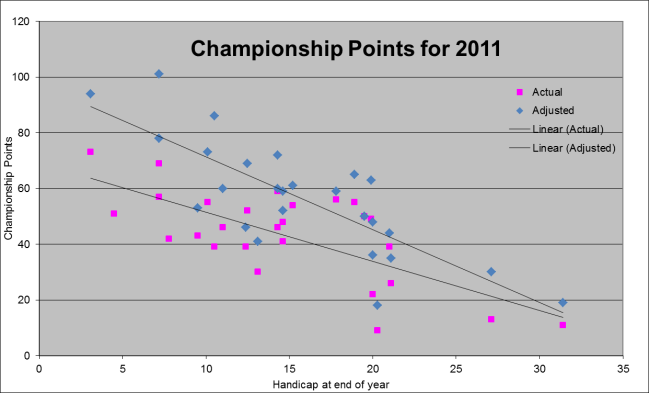
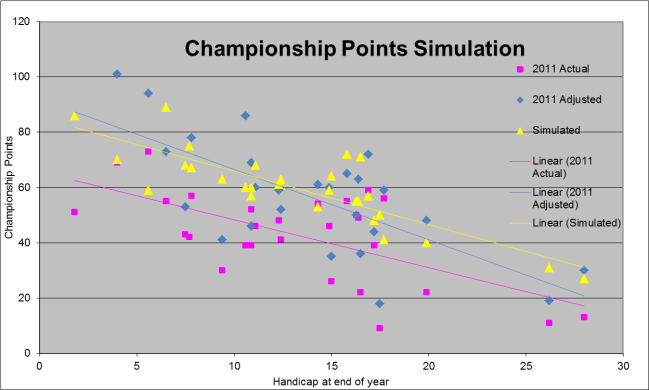
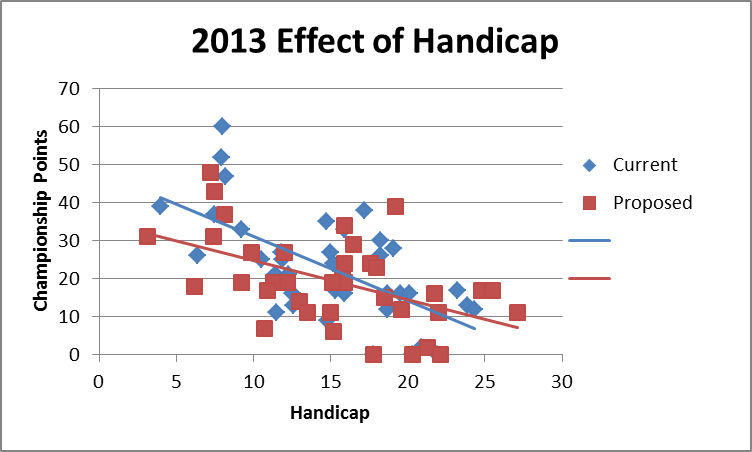
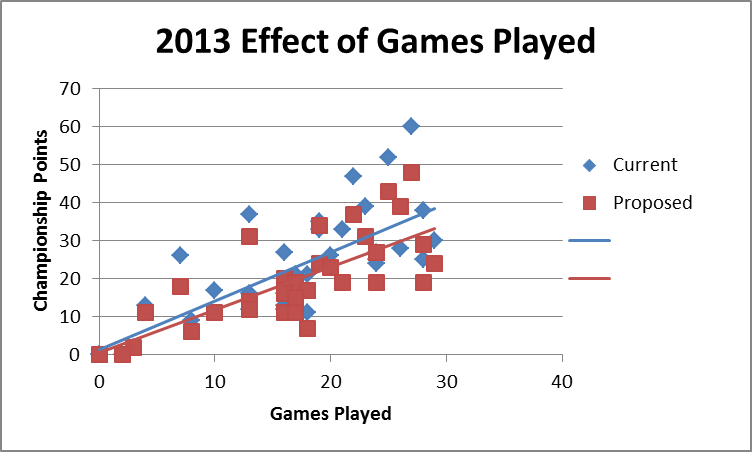
The number of championship points scored in the 2011 year have been compared with the finishing handicap for the year of each player scoring points. These have been plotted in the following chart. From this it can be seen that there is a strong trend evident. It must be noted that this result is affected to some degree by the fact that players do not play in every event. There is no evidence to suggest that number of games played is related to handicap or vice versa.
Because of the latter, the points scored have been adjusted by the ratio of number of games played to the maximum number played to indicate the position if players continued to score at the same rate per game. This is a bit artificial as it is likely that handicaps would have changed and scoring capacity with it. Two values were excluded from this set for low game number players that had resulted in scores that were considered to be outside the realms of possibility.
This theoretical result showed no change in the final outcome of the competition in that low handicap players consistently outscored high handicap players.
Players with low handicaps are over represented and players with high handicaps are under represented in both winning and being placed in events.
As a result of this, the Club Championship points table shows a similar trend favouring the low handicap player.
Handicap relief (outwards movement) is 0.3 for players below 18.5 and 0.2 for players above 18.5
The winner penalty is 0.5 stroke for players below 10.5 and 1 stroke for players above 10.5. This means that a low handicap player recovers from this penalty and is in positive territory after two weeks of not playing to handicap, an intermediate handicap player is in positive territory after 4 weeks while a high handicap player is only in positive territory after 6 weeks.
Handicapping increment is graded ranging from 0.2 strokes/stroke below 9.5 up to 0.7 strokes/stroke above 31.5. This means that a low handicap player recovers (exact handicap) a one stroke break (and more) after one week of not playing to handicap while higher handicap players can take up to four weeks to achieve the same result.
On the face of it then, there would seem to be some sort of a case to review the existing handicapping system to see whether it can be modified to make the competition more balanced for all players. Obviously, any system has to be responsive enough to reflect genuine changes in a players form but also with enough inertia to discourage thoughts of burgling. In an attempt to investigate possible changes some further calculations have been done.
One method of assessing consistency is the range of scores that a player returns. There is a somewhat complicated statistical measure called standard deviation that does this. A wide spread of scores would correspond with a high standard deviation and vice versa.
The stroke scores for each player were collated and the average score for the period (three years) and the standard deviation of the scores were calculated.
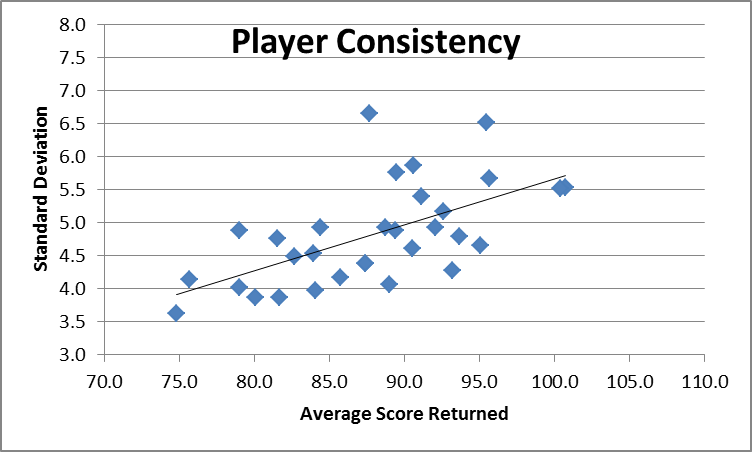
This shows that players returning lower scores have a lower standard deviation while players returning higher scores have a higher standard deviation.
What exactly does the standard deviation mean? Basically if the score on any given day is truly random, the chance of a player returning a score outside the range one standard deviation below the average score is about 1 in 6.
Let us consider two players who are fairly handicapped to their average score, one on a low handicap with a standard deviation (sd) of 4 and a high handicapper with an sd of 6. If the low handicap player has his 1 in 6 round (5 under) he is penalised 1 stroke which is one quarter of his sd which will have some impact on his chances of breaking but he is virtually back to his regular exact handicap in three weeks. If the high handicap player does the same (7 under) he is penalised as high as 4.9 (5 ) strokes which is much closer to his whole sd with a much more significant impact on the probability of breaking and would take 10 weeks to claw back.
In order to be able to assess potential changes to the handicapping system, it is necessary to be able to do the calculations with a realistic set of data as if every player was present for every round during the playing year. This data was prepared using a random number generator in an Excel spreadsheet using the average scores and sd calculated previously. The simulated scores were then subjected to place calculation and handicap adjustment as if they were submitted to the handicapper. The requisite number of two week events were included in the calculations. It was not possible to include the bonus points allocated to the matchplay finalists.
The first thing to consider is whether the results of the simulation are in agreement with the real world results.
In the first instance, we will look at the results for Championship Points for a simulated year. The simulation (left hand chart) shows the same bias towards low handicap players as does the real result.
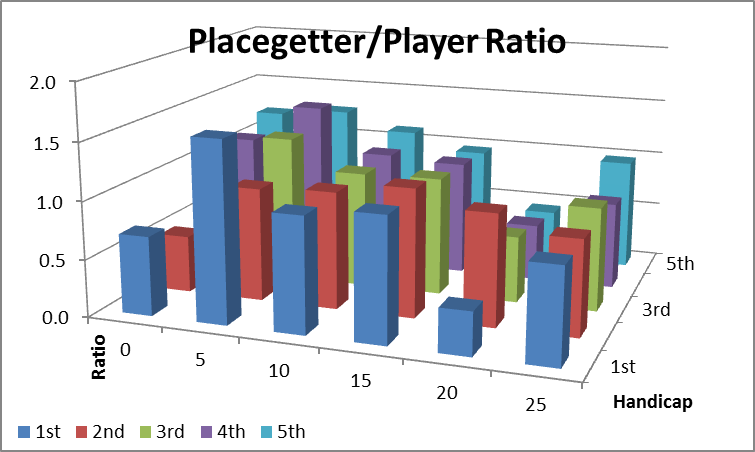
The right hand chart shows the ratio of place-getters to players competing by handicap range for the simulated results. As for the real result analysis, there is a strong bias for short handicap players to be placed first and throughout the range of places. This bias, combined with the relatively large number of points that are awarded for first place is a major factor in the championship points distribution.
The following factors have been identified as possibly contributing to the evidence of bias in the Club Handicapping System.
Asymmetric handicap relief
Different winner penalties
Graduated handicap penalties
Weighted points allocation
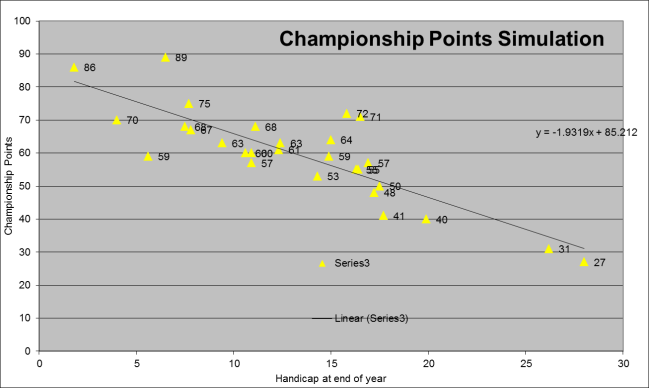
In an ideal handicapping system, the point-scorer to player ratio would be close to one through all handicap ranges. For the championship points distribution, the trend line versus handicap would be horizontal. A measure of the inclination of the line is known as the slope and for a horizontal line the slope is zero. The following chart shows the trend line for the simulation of the current handicapping system for a full year. The slope of the line is -1.93 (the minus sign just means that as the handicap increases, the indicated number of points scored decreases).
The same randomly selected set of simulated scores has been used to test the use of a number of variations of the handicapping system to indicate how something closer to the ideal system might be achieved. The changes were done in stages to give an indication of the relative importance of each variation. The results of these calculations are shown in the following table.
|
Version |
Cuts |
Winners |
Letouts |
Points |
Slope |
|
Current |
0.2, 0.3, 0.4, 0.5, 0.6, 0.7 |
0.5, 1.0 |
0.3, 0.2 |
8, 5, 3, 2, 1 |
-1.93 |
|
VerA |
0.2, 0.3, 0.4, 0.5, 0.6, 0.7 |
0.5, 1.0 |
0.2, 0.3 |
8, 5, 3, 2, 1 |
-1.22 |
|
VerB |
0.2, 0.3, 0.4, 0.5, 0.6, 0.7 |
1.0 |
0.2, 0.3 |
8, 5, 3, 2, 1 |
-0.58 |
|
VerC |
0.2, 0.3, 0.4, 0.5, 0.6, 0.7 |
0.5, 1.0 |
0.2, 0.3, 0.4, 0.5, 0.6, 0.7 |
8, 5, 3, 2, 1 |
-1.02 |
|
VerF |
0.2, 0.3, 0.4, 0.5, 0.6, 0.7 |
0.2, 0.3, 0.4, 0.5, 0.6, 0.7 |
0.2, 0.3, 0.4, 0.5, 0.6, 0.7 |
5, 4, 3, 2, 1 |
-0.68 |
|
VerD |
0.2, 0.3, 0.4, 0.5, 0.6, 0.7 |
1.0 |
0.2, 0.3 |
5, 4, 3, 2, 1 |
-0.25 |
|
VerE |
0.2 |
0.5, 1.0 |
0.2, 0.3 |
5, 4, 3, 2, 1 |
+0.09 |
From this table it can be seen that it is possible to produce a system that theoretically gives all players a more equal chance at winning the Club Championship (ignoring the Matchplay result).
In order to illustrate this, the simulation was run 10 times with the Current System and 10 times with verE. Each run used a different set of simulated scores for each player. The names of the players and their handicap in March 2012 from each set of simulations are listed in the following Table together with actual winners from the last ten years.
|
Current System |
Handicap |
VersionE |
Handicap |
Actual |
Handicap |
|
Oliver |
9 |
Mal F |
21 |
Andrew P |
3 |
|
David R |
5 |
Damian |
9 |
Damien |
7 |
|
Damien |
9 |
Mehmet |
13 |
Damien |
8 |
|
Brendon |
10 |
Gordon |
13 |
Chris |
11 |
|
Damien |
9 |
Mal F |
21 |
Oliver |
6 |
|
Brendon |
10 |
David R |
5 |
Chris |
8 |
|
Chris |
10 |
Mal A |
27 |
Stuart |
5 |
|
David R |
5 |
David R |
5 |
Paul |
4 |
|
Andrew P |
5 |
Mike |
23 |
Allan |
16 |
|
Stefan |
8 |
Gordon |
13 |
Stuart |
11 |
From this table, it is clear that, in the simulations of the current handicap system and in the real world, the majority of Club Championship winners have come from the ranks of the lower handicap players. From the VersionE simulations, the winners show a full spread of handicaps and although there are names repeated in the list this is just a feature of statistical variation. A large number of simulations would be required to even these fluctuations out.
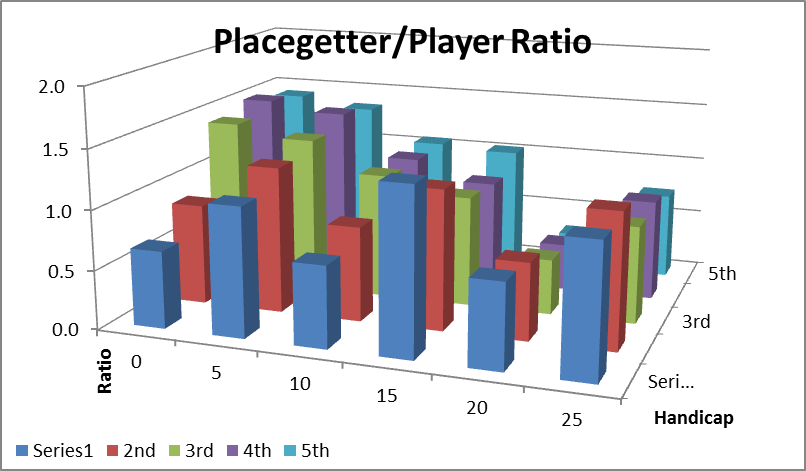
The Placegetter/Player Ratio chart above from a VersionE simulation confirms that there is generally a more even distribution across the handicap ranges, particularly for winners.
On the basis of this analysis, it is recommended that the committee considers changing the handicapping system used by Ivanhoe Golf Club to comply with the values listed in VersionE. The per stroke cut becomes constant for all players. The winners penalty remains as for the current system. The handicap relief values are reversed. The placing points for first and second place are reduced.
These changes can be easily accommodated in the existing handicapping software.
The following table was prepared from the scores returned by players in 2013 up until the end of July. It shows the Championship table at that time and compares it to the table that would have resulted if the proposed Version E had been in place.
|
CURRENT SYSTEM |
VERSION E |
VERSION E CURRENT ORDER |
|
|||||||||
|
Player |
Points |
Games |
Hcap |
Player |
Points |
Games |
Hcap |
Player |
Points |
Games |
Hcap |
Hcap Diff |
|
GROO |
60 |
27 |
8 |
GROO |
48 |
27 |
7.2 |
GROO |
48 |
27 |
7.2 |
-0.8 |
|
LEED |
52 |
25 |
7.9 |
LEED |
43 |
25 |
7.5 |
LEED |
43 |
25 |
7.5 |
-0.4 |
|
EASB |
47 |
22 |
8.2 |
BOUH |
39 |
26 |
19.2 |
EASB |
37 |
22 |
8.1 |
-0.1 |
|
PETA |
39 |
23 |
4 |
EASB |
37 |
22 |
8.1 |
PETA |
31 |
23 |
3.1 |
-0.9 |
|
MIFA |
38 |
28 |
17.2 |
TIED |
34 |
19 |
15.9 |
MIFA |
29 |
28 |
16.5 |
-0.7 |
|
AKDK |
37 |
13 |
7.5 |
AKDK |
31 |
13 |
7.4 |
AKDK |
31 |
13 |
7.4 |
-0.1 |
|
TIED |
35 |
19 |
14.7 |
PETA |
31 |
23 |
3.1 |
TIED |
34 |
19 |
15.9 |
1.2 |
|
BUTS |
33 |
21 |
9.2 |
MIFA |
29 |
28 |
16.5 |
BUTS |
19 |
21 |
9.2 |
0 |
|
GRIK |
33 |
19 |
15.9 |
HILG |
27 |
24 |
12 |
GRIK |
24 |
19 |
15.9 |
0 |
|
MANM |
30 |
29 |
18.2 |
PRIC |
27 |
24 |
9.9 |
MANM |
24 |
29 |
17.6 |
-0.6 |
|
BOUH |
28 |
26 |
19.1 |
GRIK |
24 |
19 |
15.9 |
BOUH |
39 |
26 |
19.2 |
0.1 |
|
HILG |
27 |
24 |
11.8 |
MANM |
24 |
29 |
17.6 |
HILG |
27 |
24 |
12 |
0.2 |
|
WHIR |
27 |
16 |
15 |
AKDB |
23 |
20 |
18 |
WHIR |
20 |
16 |
15.8 |
0.8 |
|
AKDB |
26 |
20 |
18.2 |
WHIR |
20 |
16 |
15.8 |
AKDB |
23 |
20 |
18 |
-0.2 |
|
BELS |
26 |
7 |
6.4 |
AKDM |
19 |
28 |
11.3 |
BELS |
18 |
7 |
6.2 |
-0.2 |
|
AKDM |
25 |
28 |
11.9 |
BUTS |
19 |
21 |
9.2 |
AKDM |
19 |
28 |
11.3 |
-0.6 |
|
PRIC |
25 |
24 |
10.5 |
MIFT |
19 |
17 |
15.9 |
PRIC |
27 |
24 |
9.9 |
-0.6 |
|
SABM |
24 |
24 |
15.2 |
SABM |
19 |
24 |
15.1 |
SABM |
19 |
24 |
15.1 |
-0.1 |
|
SHAC |
21 |
18 |
11.4 |
SULS |
19 |
17 |
12.2 |
SHAC |
17 |
18 |
10.9 |
-0.5 |
|
SULS |
21 |
17 |
12.3 |
BELS |
18 |
7 |
6.2 |
SULS |
19 |
17 |
12.2 |
-0.1 |
|
HALR |
17 |
10 |
15.3 |
JACT |
17 |
18 |
24.8 |
HALR |
11 |
10 |
15 |
-0.3 |
|
JACT |
17 |
18 |
23.2 |
MCDB |
17 |
16 |
25.5 |
JACT |
17 |
18 |
24.8 |
1.6 |
|
BLIA |
16 |
17 |
18.7 |
SHAC |
17 |
18 |
10.9 |
BLIA |
15 |
17 |
18.5 |
-0.2 |
|
FLEM |
16 |
17 |
19.5 |
GRAR |
16 |
16 |
21.7 |
FLEM |
11 |
17 |
22 |
2.5 |
|
GRAR |
16 |
16 |
20.1 |
BLIA |
15 |
17 |
18.5 |
GRAR |
16 |
16 |
21.7 |
1.6 |
|
MIFT |
16 |
17 |
15.9 |
SIEJ |
14 |
13 |
13 |
MIFT |
19 |
17 |
15.9 |
0 |
|
SIEJ |
16 |
13 |
12.5 |
HOWD |
12 |
13 |
19.6 |
SIEJ |
14 |
13 |
13 |
0.5 |
|
DEMG |
13 |
4 |
12.6 |
ADEM |
11 |
16 |
27.1 |
DEMG |
11 |
4 |
13.5 |
0.9 |
|
MCDB |
13 |
16 |
23.9 |
DEMG |
11 |
4 |
13.5 |
MCDB |
17 |
16 |
25.5 |
1.6 |
|
ADEM |
12 |
16 |
24.3 |
FLEM |
11 |
17 |
22 |
ADEM |
11 |
16 |
27.1 |
2.8 |
|
HOWD |
12 |
13 |
18.7 |
HALR |
11 |
10 |
15 |
HOWD |
12 |
13 |
19.6 |
0.9 |
|
MITB |
11 |
18 |
11.5 |
MITB |
7 |
18 |
10.7 |
MITB |
7 |
18 |
10.7 |
-0.8 |
|
KLOE |
9 |
8 |
14.8 |
KLOE |
6 |
8 |
15.2 |
KLOE |
6 |
8 |
15.2 |
0.4 |
|
ANDP |
2 |
3 |
20.9 |
ANDP |
2 |
3 |
21.3 |
ANDP |
2 |
3 |
21.3 |
0.4 |
|
CLAR |
0 |
0 |
17.8 |
CLAR |
0 |
0 |
17.8 |
CLAR |
0 |
0 |
17.8 |
0 |
|
DAVA |
0 |
2 |
21.9 |
DAVA |
0 |
2 |
22.1 |
DAVA |
0 |
2 |
22.1 |
0.2 |
|
MANL |
0 |
0 |
20.3 |
MANL |
0 |
0 |
20.3 |
MANL |
0 |
0 |
20.3 |
0 |
Although the leaders have not changed, the number of players within twenty points of the lead has increased from three to eight and the dependence of point scoring on handicap level is reduced. Obviously, the dependence on number of rounds played is still high and cannot be eliminated.
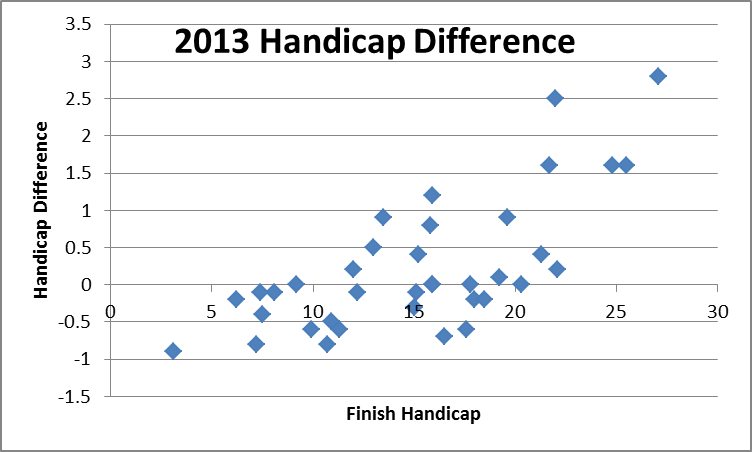
Interestingly, in general, the overall effect on peoples finishing handicap is relatively small with the largest difference being about three strokes. The variation of handicap with handicap level does show a trend as would be expected from the changes made to the system.
As pointed out in the main report, there is probably no perfect handicapping system but the proposed system addresses some of the obvious inequities in the current system, which was undoubtedly developed with the best intentions in mind but without rigourous consideration of the consequences.
One view of the current Championship is that it is more a measure of the most consistent and most frequent player in the Club – perhaps better to be known as the Clubman Championship.
One option would be to determine the Club Champion over a number of consecutive rounds as is done in many other Clubs. One possibility would be to have the last three rounds of the year (December Monthly Medal and the two rounds of the Vin O’Meara), which are all stroke rounds, to form the basis for the Club Championship. The aggregate strokes from the three rounds with the handicap at the start of the three would be used to determine the result of the event. These events are usually well attended and should not unduly prevent anybody who really aspires to the title of Club Champion from making their bid.